GPA Team • Punjab Political Strategy

Turn Data Into Clear Direction. Technology That Powers Better Decisions.
GPA Team Data Analytics & Technology transforms complex information into clear, practical insights that support smarter planning, faster coordination and better-informed decisions.
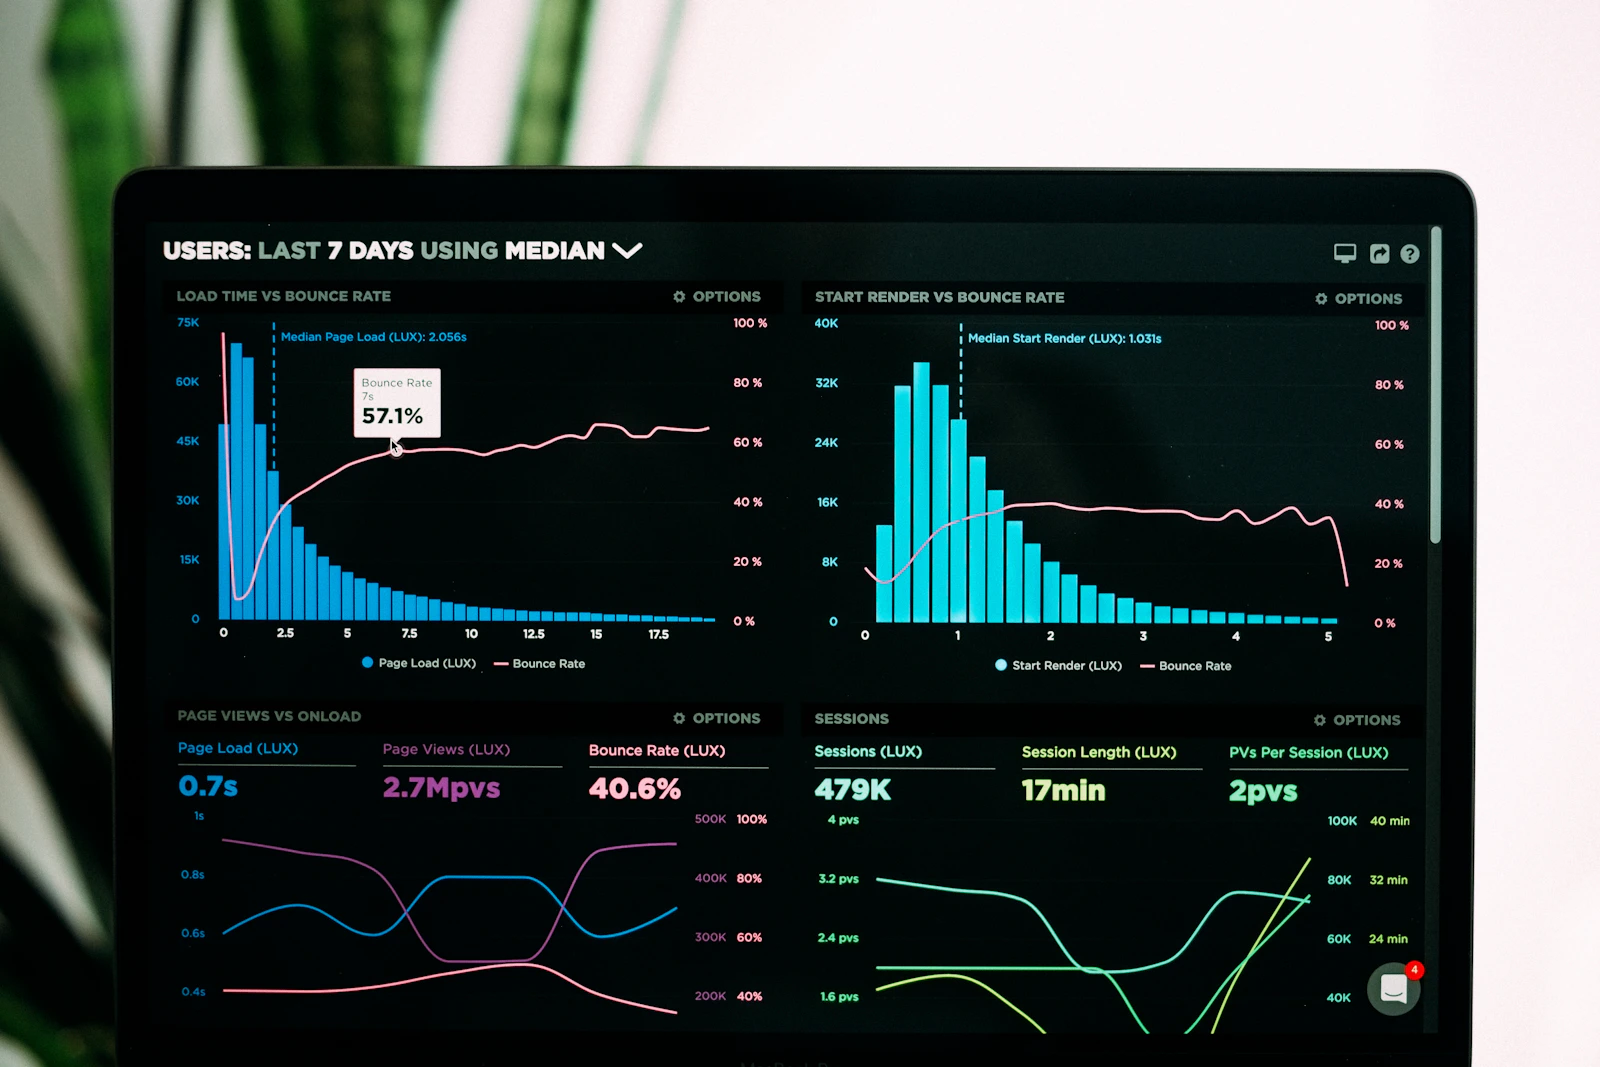
We combine research, structured data, dashboards, reporting systems and technology solutions to help leadership understand trends, monitor progress and act with greater clarity.
Better information. Smarter planning. Stronger execution.
Data becomes valuable only when it is organised, understood and converted into practical action. Our approach connects research, technology and reporting so decision-makers can focus on what matters most.
Intelligence designed for real decisions.
We develop practical systems that organise information, improve visibility and make important trends easier to understand. Solutions are designed according to the organisation, campaign and operational requirement.
Data Strategy & Planning
Define what information matters, how it will be collected and how insights will support strategic and operational decisions.
Research & Survey Analysis
Organise and analyse authorised research, survey and feedback data to understand broad trends, concerns and priorities.
Constituency Intelligence
Structured area-level information, issue mapping and aggregate insights that improve planning and resource visibility.
Smart Dashboards
Clear visual dashboards that present important indicators, activity status and trends in an easy-to-review format.
Field Data Management
Structured systems for authorised operational reporting, field activity, issue updates and team-level progress.
Data Quality & Validation
Improve consistency and reliability through structured formats, validation, review processes and data hygiene.
Technology Integration
Connect digital tools and workflows to reduce repetitive work and make operational information easier to access.
Reports & Decision Insights
Convert complex information into concise reports highlighting important patterns, progress and areas requiring attention.
From raw information to actionable intelligence.
A disciplined five-stage process ensures information remains structured, relevant, understandable and useful for decision-making.
Collect
Gather relevant authorised information through structured operational, research and reporting systems.
Organise
Standardise information into clear formats that improve consistency and usability.
Analyze
Identify broad patterns, changes, priorities and meaningful relationships within the data.
Visualize
Present information through simple dashboards, charts and concise reporting views.
Decide
Convert relevant insights into practical priorities, decisions and next actions.
See what matters. Understand what changed. Decide what comes next.
Our reporting systems are designed to give leadership a concise view of important information without overwhelming decision-makers with unnecessary detail.
Leadership Dashboards
High-level views of priorities, activities, trends and important developments.
Area-Level Insights
Structured aggregate information that helps understand different areas and operational priorities.
Progress Monitoring
Compare plans with actual activity and identify areas requiring follow-up.
Decision Briefs
Short, practical summaries that convert analysis into clear management-level insights.
Practical technology systems built around real requirements.
Every solution is customised according to the information available, operational requirement and decision-making priorities.
Data Framework
A structured plan defining important data points, reporting formats, collection and review processes.
Leadership Dashboard
Clear visual overview of selected indicators, progress and important information.
Research Analysis
Structured interpretation of authorised surveys, feedback and research information.
Reporting System
Standardised daily, weekly or periodic reporting according to operational requirements.
Technology Workflow
Digital processes designed to improve coordination and reduce repetitive manual work.
Decision Insight Report
Concise analysis highlighting notable trends, changes and areas requiring management attention.
Technology with purpose. Data with responsibility.
Our approach focuses on useful, authorised and responsibly managed information. We combine political understanding with structured analytics and practical technology to make complex information easier to use.
Turn complex data into clear, confident decisions.
Connect with GPA Team for practical analytics, reporting dashboards, research insights and technology solutions designed around your needs.